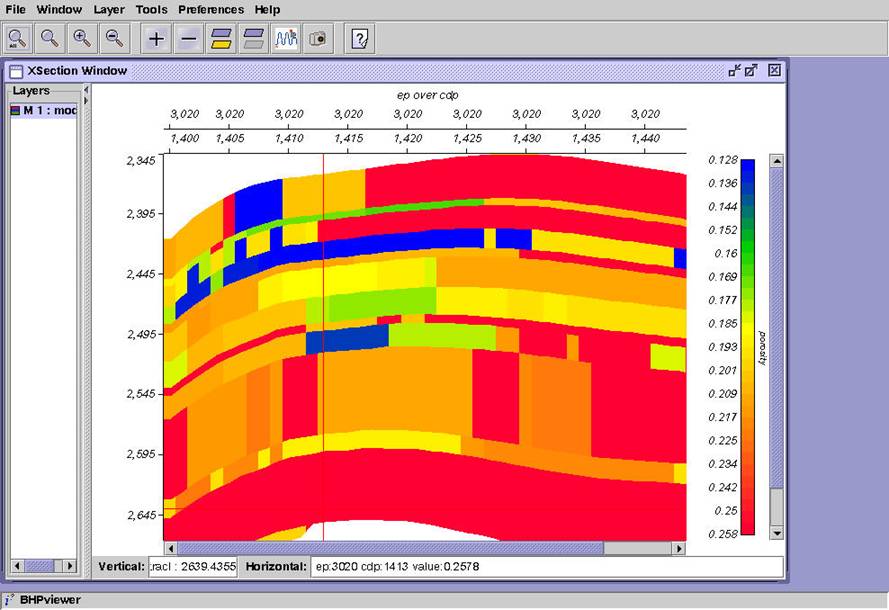
Loading and Viewing Model Data
Continuing with the same bhpview session, close the seismic data window by clicking the X in the top right-hand corner of the XSection Window. You should now see an empty bhpview window. Click
File, then Select Data in New X-Section Window, then BHP_SU. Next you will see the data selection window again. This time, select model2 and click OK.
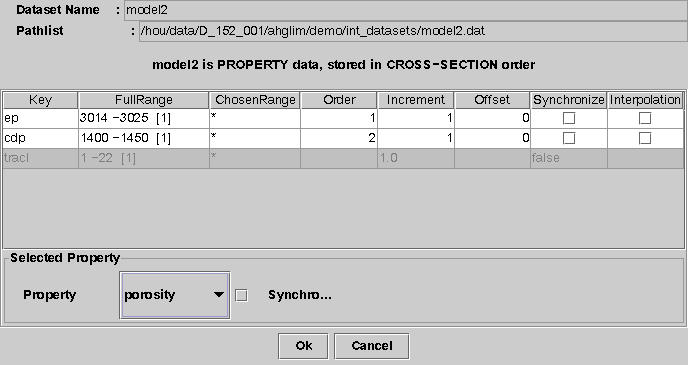
At the bottom of the of the data range window, instead of vertical range you should now see
Property with a button next to it that says porosity.Click on Porosity to see a list of available model properties.
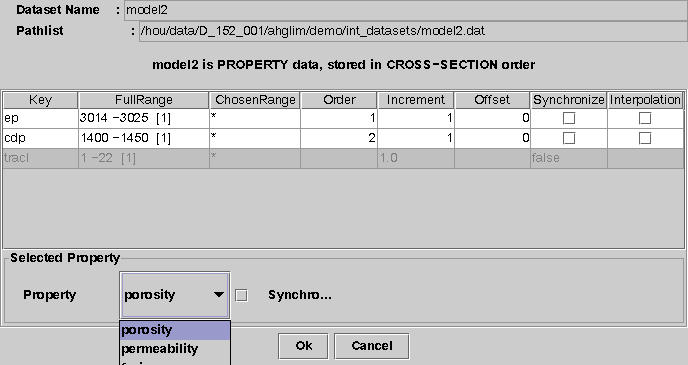
Select porosity, then go up to the data-range section and ask for ep=3020. . After the initial data window opens, make it a little bigger, and enlarge the layer-name section. Then double-click the layer name, and select the Display Parameters tab.
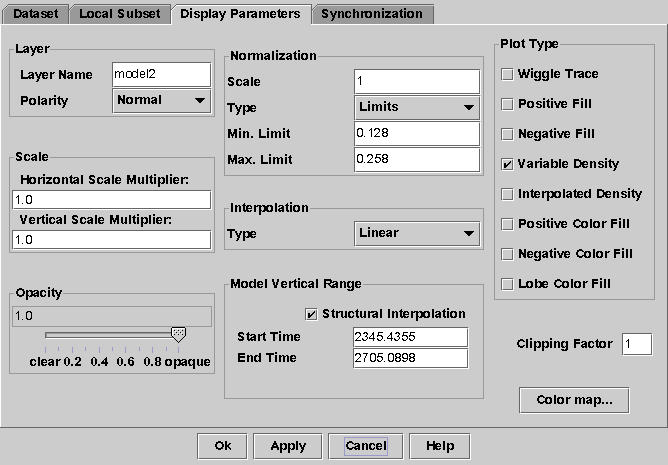
Notice some differences in the type of information for model data vs. seismic data. Instead of AGC, you now see Model Vertical Range, which shows start and end depth for model2. Note that Structural Interpolation is turned on. Try turning it off and clicking Apply to see the difference. In the Normalization section, note that data is being normalized according to the porosity range. Click Limits to see available normalization types. The model would probably be more interesting in color. Click Color map…
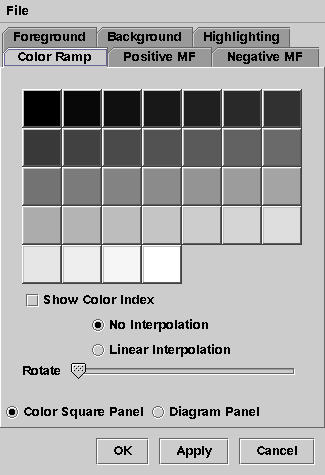
What you see is the default grayscale color map. Click File, then Load. Navigate the file browser to point to /hou/data/D_152_001/SU_Class/class_project/colobar. One way to do this is to type part of the path in the text box, then click Open, then click names in the dialog box, followed by Open, until you get there.
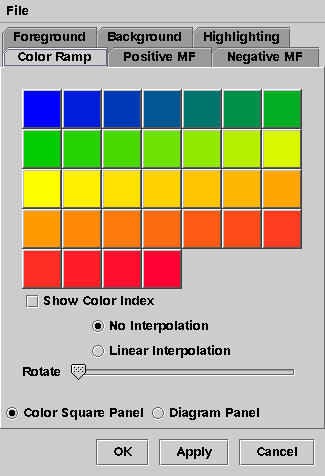
Now click OK, which returns you to Display Parameters, and then OK again.
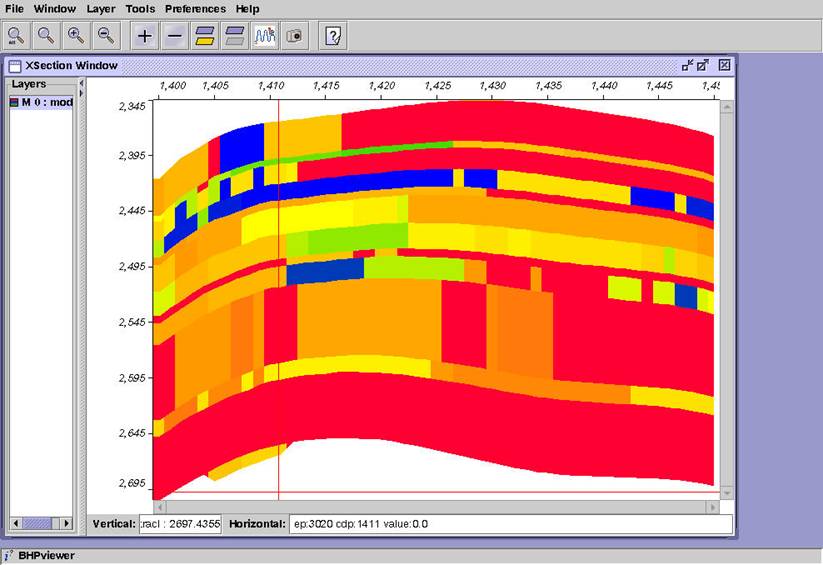
The colors are nice, but we need to know which colors mean what porosity values. Select the Window pull-down menu, then Annotation.
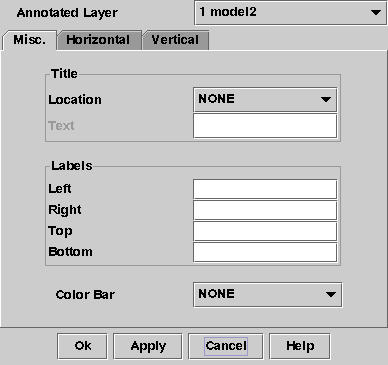
Next to Color Bar, click the button to see choices. Choose Right, then OK to close the annotation window.
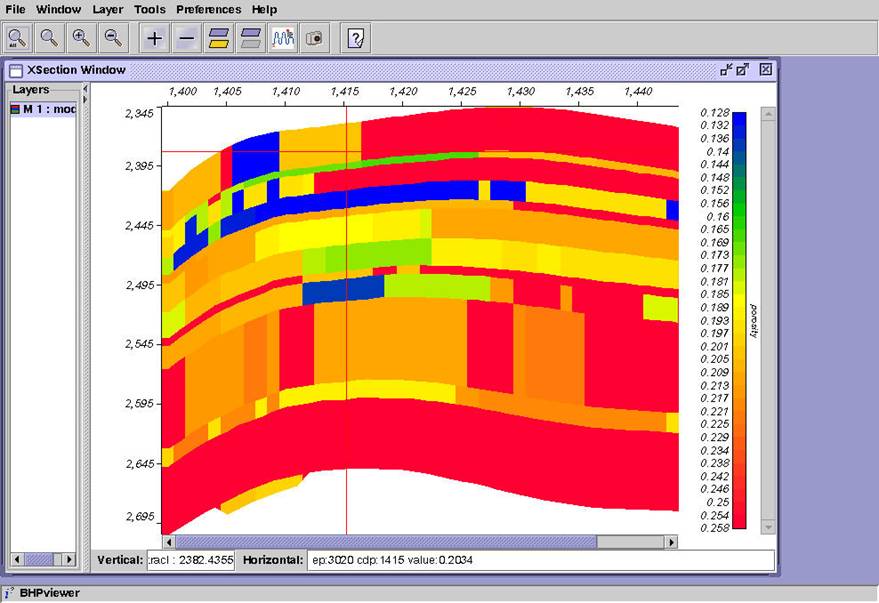
Now add another row of trace-header annotation across the top. Open annotation window again.
Select the Horizontal tab.
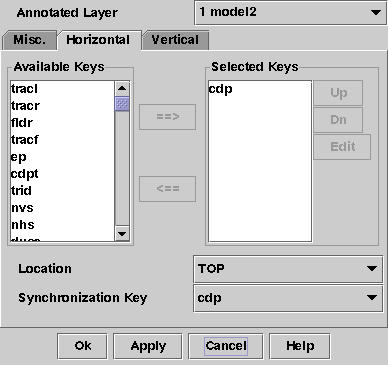
You can see that the current horizontal header is CDP. Add ep by selecting ep in the left-hand list and clicking the è symbol to move it to the active list, then click OK.
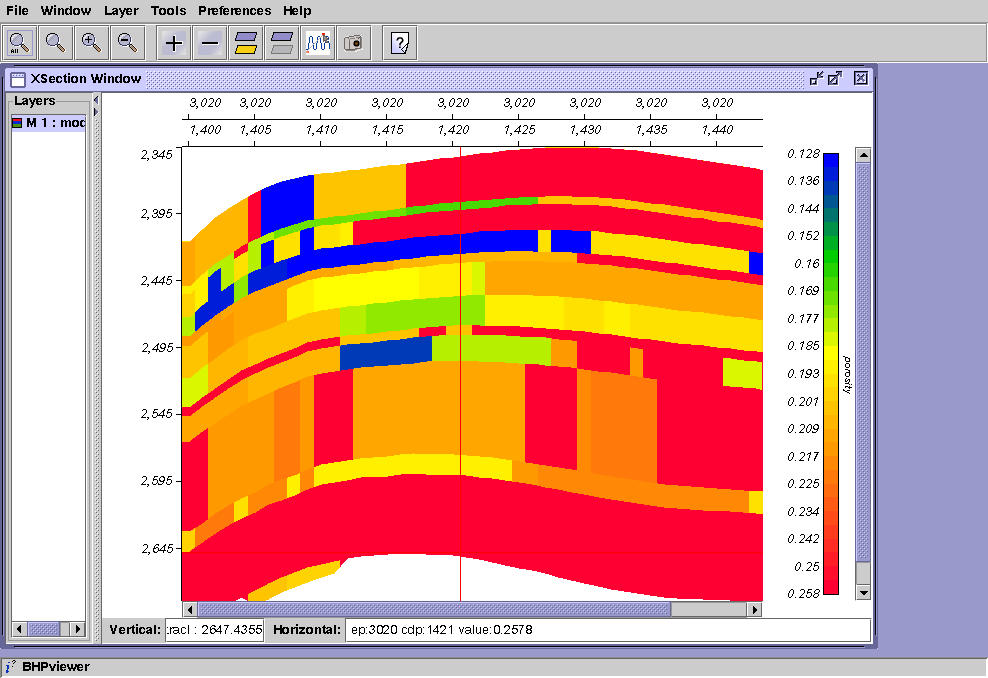
You should now have two rows of horizontal annotation. Now add a label above the annotation by returning to the annotation window.
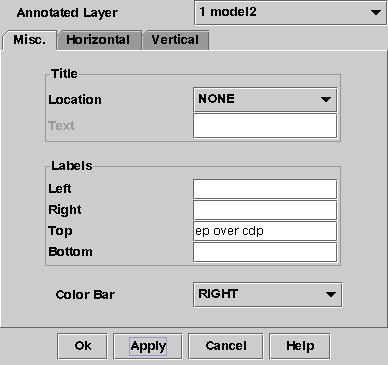
Enter ep over cdp in the text box next to Top in the Labels section and click OK.